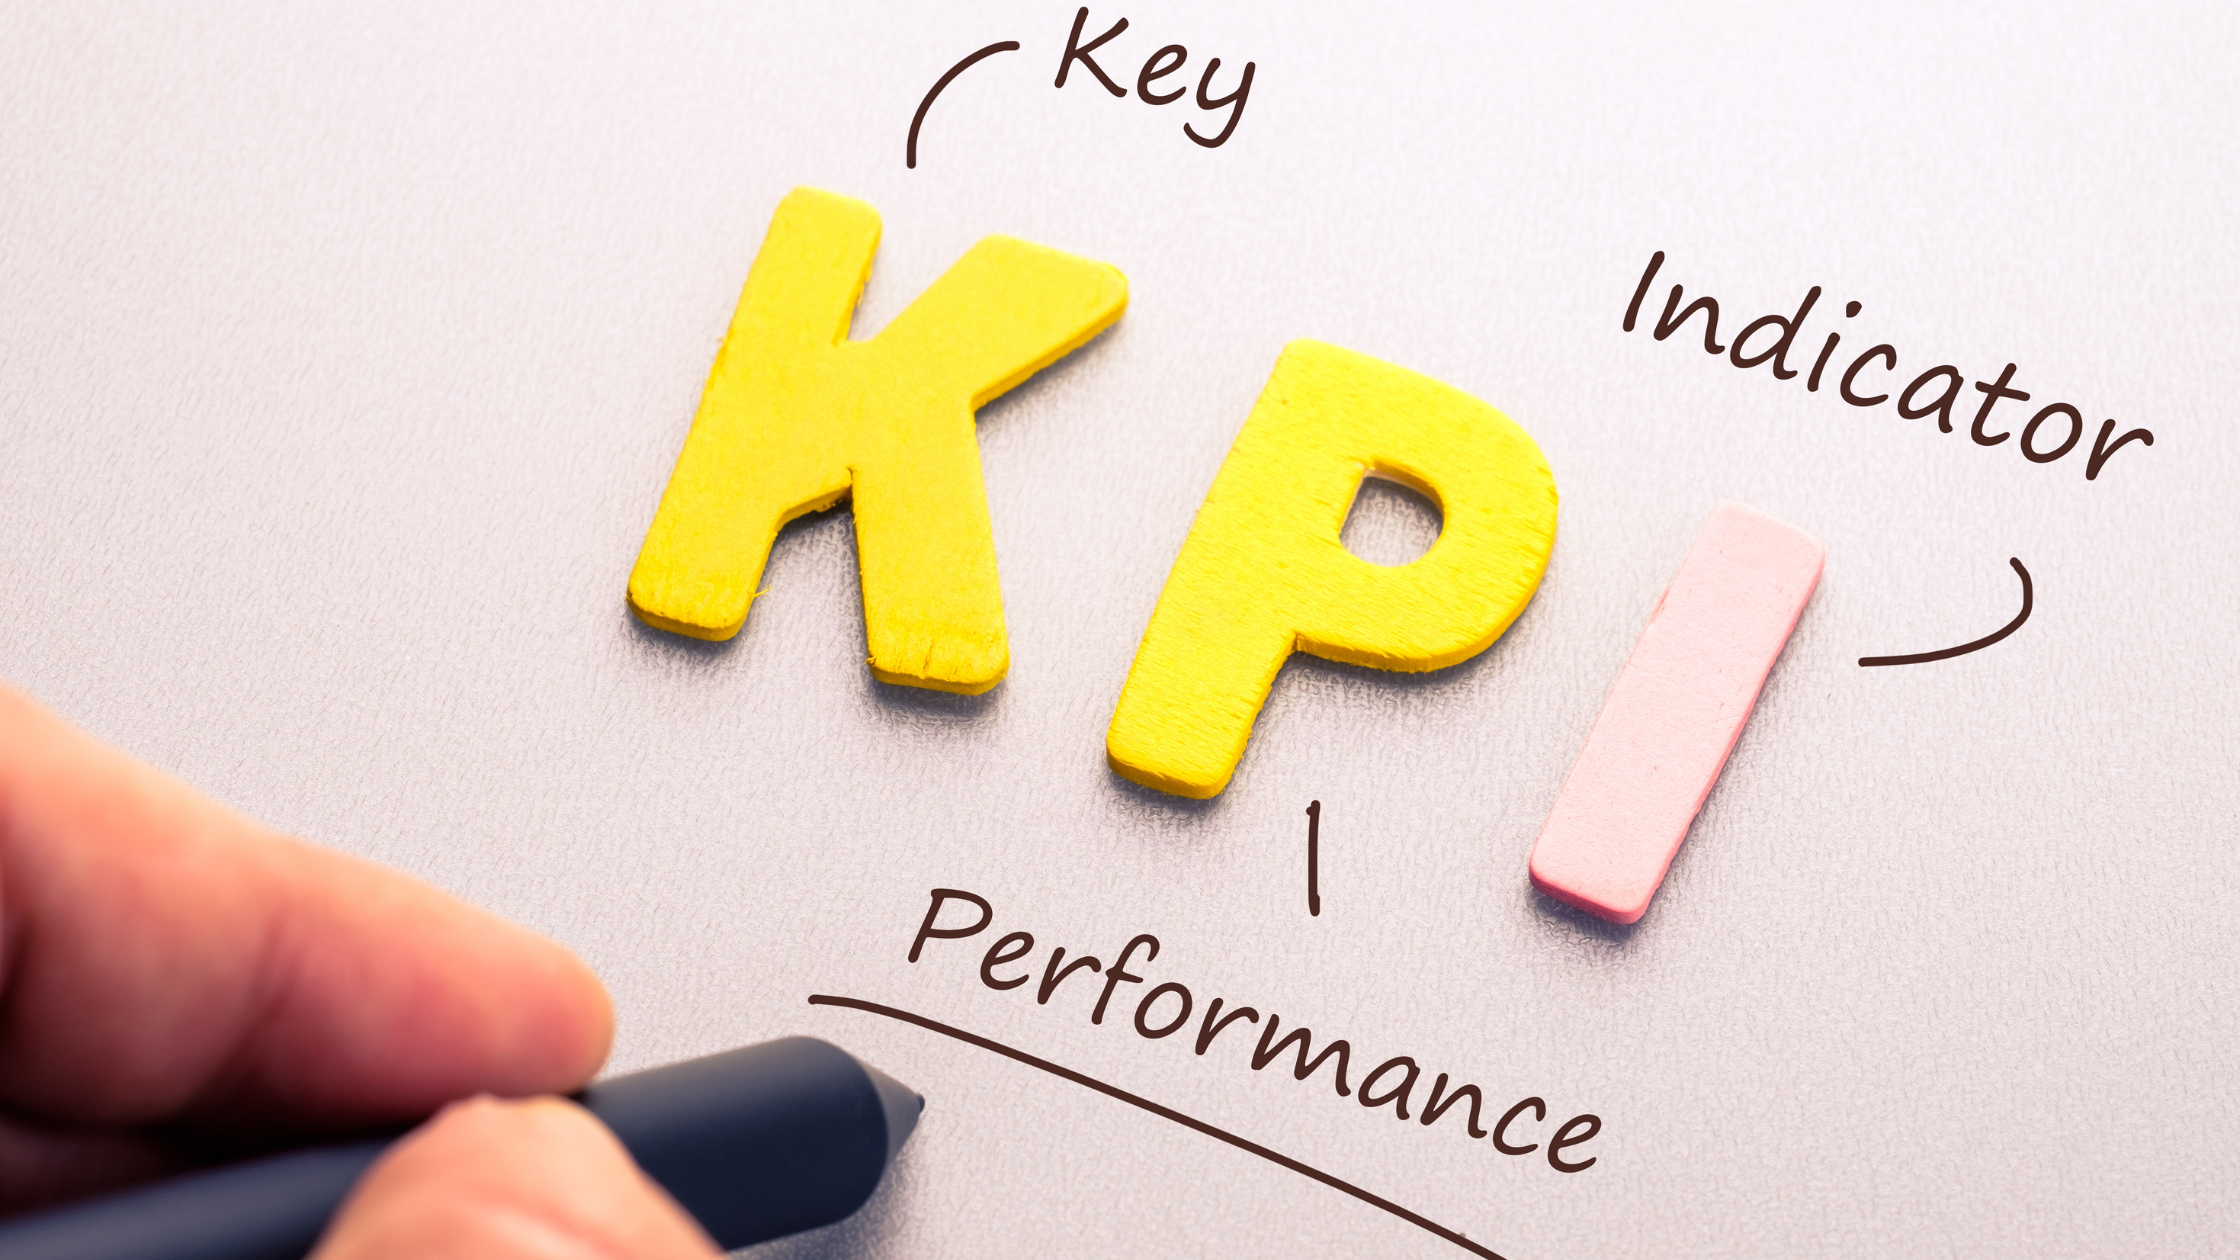
What are Key Performance Indicators or KPIs?
Key performance indicators, or KPIs, are variables that you can measure to determine your business’ success in a particular area. Not to be confused with metrics, KPIs align with your goals and objectives. By tracking these performance indicators, you can gain valuable insight into your people, product, and revenue. Tracking KPIs also allows you to predict future performance. If you’re not tracking your key performance indicators, you’re missing out on critical information.
Types of Key Performance Indicators
There are many different types of key indicators you can choose to track. Depending on your business, you’re likely to track quite a few performance indicators. Here are some indicators that you may want to track.
Input Indicators and Output Indicators
Input indicators help you track the resources you use to achieve your desired outcome. You can track funding, department size, or raw materials purchased. Whatever goes into production can be tracked as an input indicator.
Output indicators pertain to production and the results of production. You can track results like goods made, customers acquired, and revenue generated. Your output indicators let you know how well your production processes are running.
Financial Indicators
Financial indicators can show you your business’ financial viability. Tracking variables like revenue, inventory turnover, and operating costs tells you where your business is and where it’s headed. Monitoring key financial indicators helps you plan for a financially healthy future.
Quantitative Indicators
Quantitative indicators are variables represented by numbers, i.e., ratios, percentages, weight, and currency. Much of what your business does can be represented by numbers. What you choose to measure should align with your goals. A business interested in growing their social media presence may focus on post engagements, website visits, and follower growth. These numbers will be a good indicator of objective success.
Qualitative Indicators
Alternatively to quantitative indicators, qualitative can be harder to measure. Qualitative indicators are feelings or thoughts. For example, you may provide customers with a satisfaction survey. Their answers are qualitative indicators of your business’ performance. Additionally, qualitative indicators may show you gaps in processes or departments. In the case of a survey, you may find that the product was well-made, but the packaging was damaged. With this information, you can adjust accordingly.
Leading and Lagging Indicators
Leading indicators are performance-based markers that determine and predict future success. For example, a business may choose to measure the number of sample requests for a certain product to predict the success of a full product launch.
Lagging indicators measure current performance. These unchanging data points may be gross revenue, profit loss, and yearly client retention.
Examples of Key Performance Indicators by Department
KPIs can be measured for any department. You can monitor success amongst your customer service team, the marketing department, and even human resources. All goals can be monitored through key performance indicator tracking. Here are some examples of indicators you can track.
Sales
Your sales goals may range from an increase in contracts to a decrease in customer acquisition costs. Regardless of what you sell, you’ll likely want to monitor some of these sales performance indicators.
- Number of qualified and engaged leads
- Average cost of new client acquisition
- Returning customer percentage
- Total number of sales
Financial
You’re likely already tracking financial performance indicators. You want to know how much you’re spending and what you’re getting back. Here are some typical financial performance indicators.
- Gross profit margin
- Net profit margin
- Revenue growth
- Excess inventory
Customer Service
You want the best for your customers. Tracking customer service performance indicators can tell you how successful your business is at resolving issues. The following KPIs will give you more information about your customer service performance.
- Average resolution time
- Number of escalations
- Customer satisfaction score (obtained from a survey)
Human Resources
Your people are key to achieving your objectives. Tracking human resource indicators can prove invaluable when examining your company culture. The following variables can provide great insight.
- Number of vacant positions
- Cost of new hire
- Average salary
- Employee turnover rate
- Average employee satisfaction rate
Social Media Marketing
Social media goals may include growing your online presence, engagement, and customer acquisition. To monitor your performance, you may want to consider the following social media performance indicators.
- Followers gained
- Clickthroughs
- Posts produced
- Page visits (daily, weekly, monthly)
- Specific engagements (likes, reblogs, tags)
- Website traffic from social media
The Difference Between KPIs and Metrics
You may have heard key performance indicators and metrics used interchangeably, but they serve different purposes. Though both provide you with information about your business performance, KPIs are objective-based. Metrics pertain to specific processes and actions. For example, customer retention could be a key performance indicator, while the reason for item return is a metric. In this example, your business would examine customer retention rates to judge success in the customer service department. Whereas the reason for the return is an open-ended response that may or may not relate to a company goal.
How to Define Your KPIs
While there are many ways to measure your company’s success, tracking your KPIs is an easy way to monitor progress and predict the future. Tracking begins with defining your key performance indicators. It’s simple enough to do, and you likely already have some KPIs you monitor regularly.
Set Goals and Objectives
You want to see a positive cause-and-effect relationship between your KPI and your goal. So, you should first think about what you want to achieve. What benchmarks do you want your business to reach? You can develop KPIs for any department, provided you have a goal in mind.
Find Measurable Variables
Because key performance indicators are target-oriented, they should be realistic and relevant to the outcome. For example, if your goal is to see a lower employee turnover rate, you should monitor position vacancies versus the number of applicants.
Determine a Reporting Period
How often you monitor data is up to you. Many businesses look at some data quarterly and other data on a monthly basis. A growing business may want to track data in real time; this is possible with KPI tracking software. Routinely assessing your data can show you a timeline of effective processes or gaps in performance.
What Makes a Good KPI
We’ve already mentioned that your key performance indicators should be realistic, relevant, and measurable. Your KPIs should also be finite. While you may want insight into every process in every department, it’s more beneficial to concentrate on specific variables. KPIs should be the most important measurements of success. Your KPIs should also be understandable. If those interacting with your data don’t know what you’re measuring, they’ll struggle to determine success.
To reiterate, the best KPIs are realistic, relevant, measurable, targeted, and understandable.
The Benefits of Tracking Key Performance Indicators
There are many benefits to tracking KPIs. From examining financial health to evaluating employee satisfaction, tracking KPIs will let you know if your business is headed in the right direction. Here are a few benefits of tracking KPIs.
Determine the Success of Marketing Campaigns
Should you launch a new marketing campaign, you’ll want to monitor its performance. Tracking links clicked, and subscription sign-ups can illustrate the effectiveness of your campaign. Successful marketing can be recreated, and unsuccessful marketing can be reworked.
Predict Future Trends Based on Past Data
Examining historical data illustrates changes over time. You can utilize previous data to predict trends in customer behavior, seasonal revenue, or lead acquisition costs. Current and previous KPI data can be compared to identify positive or negative changes in performance and processes.
Measure Current Performance Towards Goals
Perhaps the largest benefit of KPI tracking is the ability to assess current performance. Key performance indicators are direct reflections of success in a particular area. For example, “average time taken to complete a request” is a high indicator of success for a company that wishes to solve problems in fewer than five minutes. When your company measures KPIs, you can identify areas of strength and improvement.
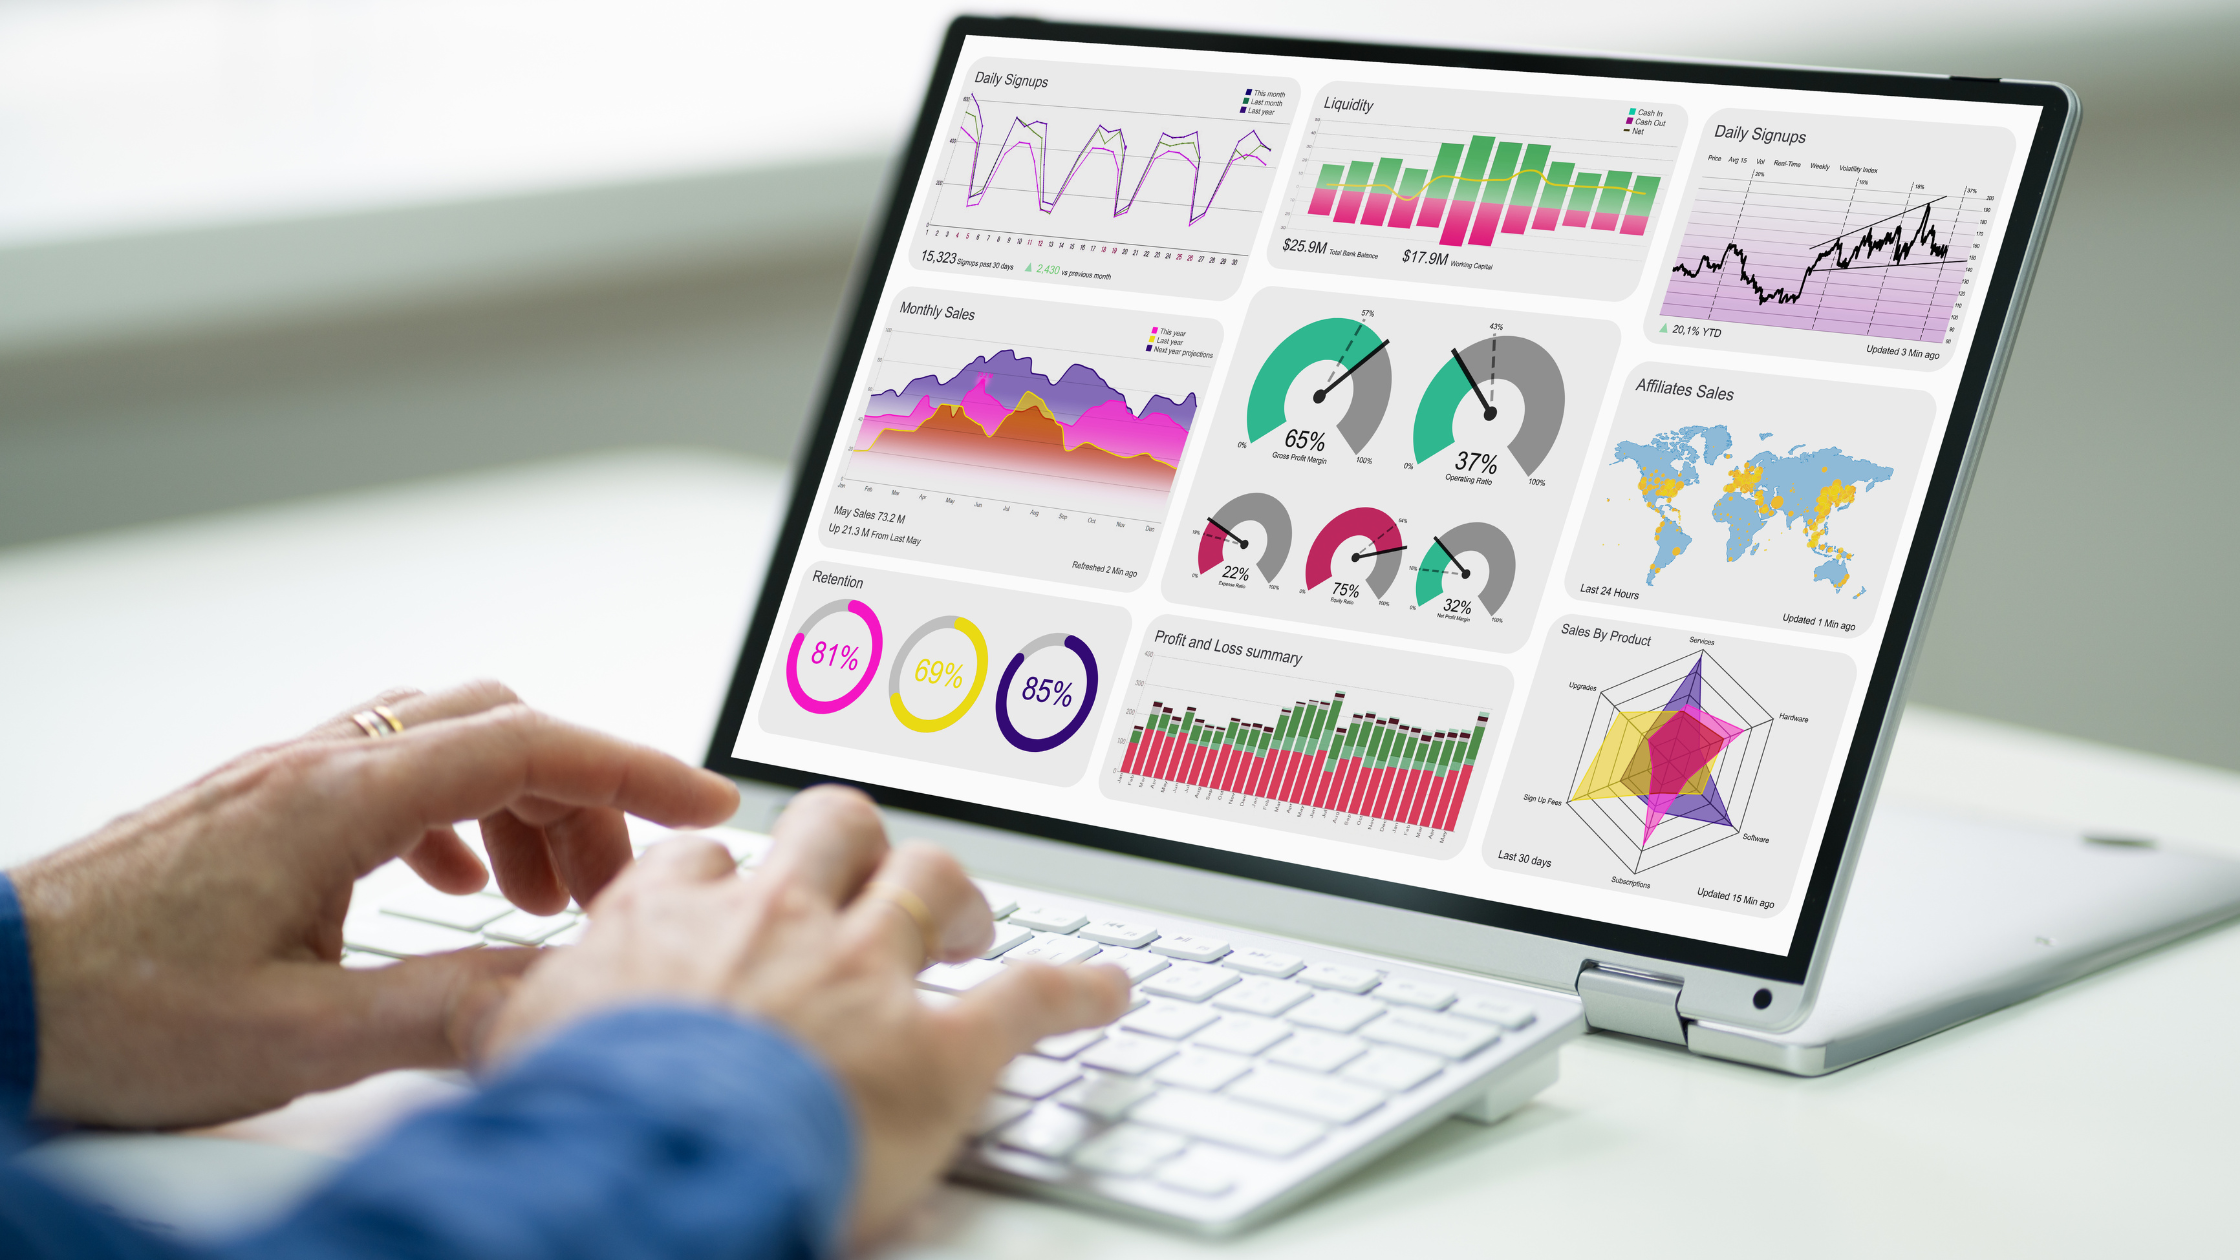
Key Performance Indicator Tracking Software
Luckily, tracking your key performance indicators is easier than ever. Many companies offer data visualization tools or dashboards. The key to picking the best KPI software depends on your business needs. Think about who will be interacting with the data input and who will be interacting with the reports. Consider if your teams need easy-to-understand visuals or if you want thorough reports with actionable insights.
Though this list is by no means complete, the following is a selection of KPI tools and software.
Databox
Databox allows you to create your own dashboard and track your key performance indicators from anywhere you’d like. This versatile tool lets you easily share data with your teams. You can even compare your performance to that of similar businesses with Databox’s benchmark feature. We love how easy it is to produce engaging visualizations of critical performance data.
Qlik
Qlik provides a variety of data-tracking tools. You can track your KPIs and use Cliq’s patented AI to gain actionable insights into your data. With Cliq’s self-service visualization, you can also empower your team to explore data on their own. This feature is a good way to encourage ownership and familiarity with relevant data.
HubSpot
HubSpot is a widely-used KPI tracking software. With HubSpot, you can create engaging and easy-to-understand dashboards. Features like sales forecasting and actionable charts can become valuable navigation tools. Growing businesses will appreciate the ongoing insight of HubSpot’s automated reports.
Tableau
Tableau is another popular performance measurement tool. Presenting data is easy and effective with Tableau’s many visualization options. Now, employees can understand their departments regardless of their ability to analyze data on their own. So if your analytics department is looking to make reports more accessible, Tableau could be a great choice.
Simple KPI
If you’re looking for an easy-to-use and intuitively designed KPI dashboard, SimpleKPI may be for you. Engineered to be user-friendly and informative, SimpleKPI gives users a thorough rundown of all tracked KPIs and metrics. You can produce robust and engaging reports that will make data meetings a breeze.
Bottom Line
Key performance indicators are targeted measurements used to determine success in a particular area of business. Good KPIs are measurable, relevant, realistic, targeted, and easy to understand. You can track your KPIs as often as you want through KPI tracking software. These programs let you visualize and share your data throughout your business so that all employees can interact with it. By tracking your KPIs, you can get a better understanding of your business and its potential future.