
A process flow diagram is a kind of flowchart illustrating various relationships between an industrial plant’s primary components. A process diagram is frequently used in the process and chemical engineering disciplines. However, the concepts are applicable to other processes. You can use one to document an existing process, enhance one, or even model something new. They might use a series of notations and symbols to depict the overall process.
Purpose and Benefits of a Process Flow Diagram
There are many benefits of a flow diagram that your organization might potentially enjoy by using them effectively.
- Documentation: When a process is documented, it leads to improved comprehension by employees, helps their training and leads to better quality control.
- Standardization: A standardized process is more efficient and repeatable. The best processes can become best practices that turn into official rules inside your organization.
- Study: When a process is studied, it’s possible to find improvements for more efficiency because you can find bottlenecks, wasted steps, and other various inefficiencies.
- Modeling: You can use this to either improve a current process or even come up with a replacement process.
- Communication: Collaboration using diagrams helps various stakeholders communicate with each other inside and outside of the organization.
If you need expert help with process diagrams and organizational charts, then that is certainly available.
Process Flow Diagram Examples
No overall process mapping is complete without specific examples you can use to see how everything works. They’re particularly useful based on different applications that are possible.

Document Approval Process
Businesses need lots of documents to record quite a few things, and so a document process is often put into place.
- Someone creates a document.
- That document is submitted to the relevant authority figures.
- The document is either approved, rejected, or destined for changes.
Incident Response Process
The longer you operate, and the bigger you get, the more likely you are to experience incidents. They can’t all be prevented, but you can often mitigate them with standardized steps.
- A threat happens.
- Your security department analyzes the threat level.
- If a threat is deemed real, management is notified.
- Management meets about the problem.
- A permanent solution is agreed upon and implemented.
Employee Onboarding Process
Bringing on new employees is a necessity for any business. The process might follow particular steps.
- Human resources send documents for a new employee to sign.
- Management and human resources verify documents are signed properly and approve them.
- Human resources let the rest of the company know about the new hire.
- An office manager prepares the new hire’s workspace, supplies, and IT access.
Process Flowchart Symbols
Many frequently used PFD symbols in modern use come from certain agencies.
- International Organization for Standardization.
- German Institute for Standardization.
- American National Standards Institute.
A standard PFD for one unit process is likely to include a base set of elements.
- Primary equipment with names and ID numbers.
- Process piping that moves product, often in fluid form, in between pieces of equipment.
- Process flow direction.
- Process-critical valves/Control valves.
- Primary recirculation and bypass systems.
- Operational data.
- Fluid composition.
- Names for process streams.
- System connections.
What to Exclude in a PFD
In many cases, PFDs exclude more detailed items.
- Code class information
- Relief valves/Safety valves
- Maintenance drains and vents
- Shutoff valves/Isolation valves
- Minor bypass valves
- Process control instruments
- Pipe classes
- Pipeline numbers
Other Types of PFDs
Sometimes, a diagram has to show more than one unit process at a particular plant. Such diagrams go by different names.
- Block flow diagrams.
- Schematic flow diagrams.
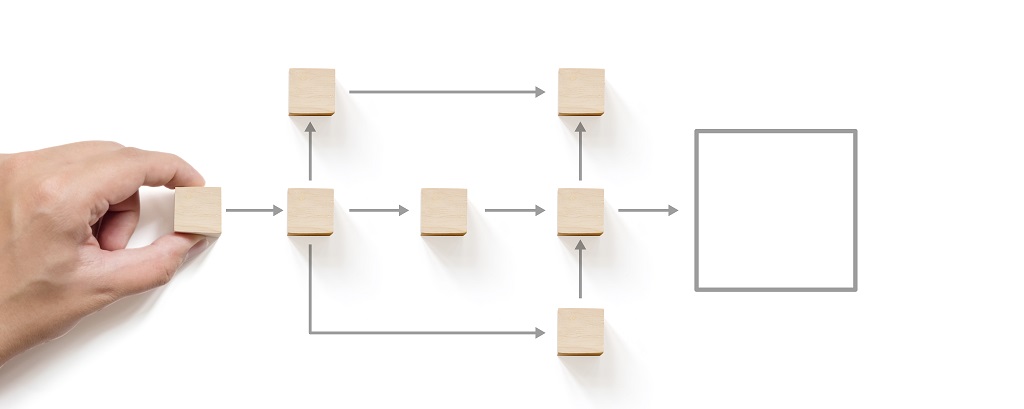
Rectangles often denote pieces of equipment, whereas labels highlight functions. A process flow usually goes from left to right. Arrows show the direction of the flow.
When the diagram needs to show multiple unit processes at a plant, it becomes more of an overview, containing less detail. These are also called Block Flow Diagrams and Schematic Flow Diagrams. Each block can depict a single piece of equipment or a stage in a process. A rectangle is usually used to show a piece of equipment and labels illustrate function. The process flow is usually shown from left to right, and arrows show flow direction.
When To Use a Flowchart?
When should you use a flowchart? Knowing when it’s right to utilize a flowchart is necessary to put them to good use. There are a variety of good reasons and applicable situations where they come into effective play.
- When you want to review an existing process with the intention of improving it.
- When you would like to document a process.
- Anytime you would like to plan out a new project.
- When you want to more effectively communicate within your organization about how a certain thing should be done.
- When it’s time to train your new hires on processes they need to know.
- When you are planning out a project.
- When you want to have a better understanding of a current process.
Need help accomplishing all of this? Schedule that now!
How to Make Process Flow Diagram
Knowing what is a process flow diagram is one thing. Actually making one is quite another. The first question is knowing whether or not you need one. If you’re looking to define each step in a process and then detail it, then the answer is yes, you need a process flow diagram.

Step 1: Identify Tasks
Start with the name of the process that needs to be defined. This should be the top line of your project board or the title of the document. Define the scope of the process, and state what you hope to get out of this. If you’re not entirely sure about any of this, talk to team members that are in the thick of things with that particular process.
Step 2: Compile the Necessary Information
Ascertain what level of detail needs to be involved. You might actually draw up different presentations based on who is receiving the information. When does this process start? When does it actually end? Dictate the exact steps, but also be mindful of events and variables that might make things go astray. Know who is responsible for what.
Step 3: Draw a Draft Diagram
Drawing a draft diagram starts with identifying every step in the process. Your draft can honestly be having each step on its own sticky note. Once you know every step is represented, put them in order. However, make sure everyone is unanimous about the specific order.
Step 4: Double-Check the Process
Have the process outline reviewed and confirmed by all stakeholders in the process. This should probably start with actual process workers before you move on to supervisors and management. However, you should also make a point to include suppliers and customers if they apply to the specific process.
Step 5: Create the Flowchart
Once you know your final process chart and all its steps in sequential order, use a notation system to formalize it. Make sure everyone understands the symbols. Disseminate the information to all relevant stakeholders, and be sure that people dealing with this process honor it regularly.
3 Visual Diagrams for Organizational Process Mapping
There are several types of process diagrams you can choose to use when trying to visualize your organizational process mapping.

#1. Flowcharts
A flowchart represents a process or workflow in sequential order so you can document, plan, and then improve sophisticated processes in a simple and readable manner. They often use shapes such as diamonds, ovals, and rectangles to reflect the various steps necessary while arrows are part of the connecting flows depicting how the sequence unfolds.
When Would You Use a Flowchart with Swimlanes?
Symbols in conjunction with horizontal and vertical lines both help a visual process diagram have swimlanes that show teams how processes are constrained, bottlenecked, or need clarification. Flowcharts using swimlanes have multiple benefits.
- Actors Defined: Process activity involves many actors in and outside of your organization, but swimlane charting identifies all of them and their roles.
- Events: Your process has distinct events that need to be linked together so everyone understands how things work together as a whole.
- Simplification: A swimlane flowchart makes it easier to see how complicated processes with many parts and actors all mesh together.
#2. Funnel Charts
One common visualization diagram is that of a funnel chart. Sales funnels are frequently depicted in this way, where the top of a funnel and its widest point reflect prospects in large before narrowing into a second and smaller level of those who actually make inquiries about products and services. The third overall and second-narrowest part of the funnel would be those prospects where actual proposals and sales are being discussed or made. The fourth and final part of the sales funnel is the group that actually turns into customers.
When Would You Use a Funnel Chart?
Funnel charts work well in sales and marketing situations, and that’s for several reasons.
- They’re effective for people who are high-level visuals in how they receive and process information.
- They’re simple to make, use, and comprehend in reflecting an overall progression.
- Funnels are adaptable so you can use them for a wide variety of functions and departments.
- Funnels let you depict change and transitions visually.
#3 Roles and Responsibilities Framework
Your organizational workflow chart should delineate roles and responsibilities within your structure. People who are being onboarded can use it to know where they stand in the overall scheme of things, and anyone can know who to report to about certain issues. Your chart might look like a network or a tree. It can incorporate names, titles, photos, and lists of responsibilities for each role involved.
When Would You Use a Roles and Responsibilities Framework?
The roles and responsibilities framework can serve two purposes. It can help your HR team identify challenges and gaps in your organizational structure, but it can also help teach new hires where they are in the internal hierarchy.
Conclusion
Defining problems for your business is where it starts before you create processes and improve them. However, you also have to make sure you actually implement them and put them into place. If you want industry-experienced professionals to help you with any of this, then contact us to see what Great Lakes Advisory can do for you.